
Inference Engine: Accelerating with CUDA
Still crunching numbers, but faster.

At the end of the last post in this series, we saw that my engine’s main bottleneck was matrix multiplication. Let’s for once use the GPU in my laptop for something other than League of Legends and accelerate the engine! By doing so, we’ll discover a couple of optimization techniques!
Baseline
In this post, we’ll focus on optimizing throughput: the number of inference requests processed per second. Tradeoffs between throughput and latency are pretty common. In ML applications, we often care about maximizing throughput while staying within overall latency tolerations.
First things first, we need to set up the benchmark. I’ll be using the MNIST neural network from part 1 of this series. We’ll time how long it takes to process 10000 images and calculate the throughput.
CPU baseline: 430μs per inference or ~2300 inferences per second.
As for hardware, I am using AMD Ryzen 5 5600H and an 80W mobile RTX 3060 with 6GB of VRAM.
Adding CUDA execution provider

Architecture
My engine supports only these operations: GEMM, ReLU, Add, and flatten. Our goal is to make these also executable on a GPU. I went through multiple iterations, starting with a basic approach to validate ideas
if (use_gpu) {
    gemm_cuda(...);
} else {
    gemm_cpu(...);
}
and later introducing abstractions to make it easier to work with. Eventually, I settled on an approach heavily inspired by ONNX runtime.
Shared inference functionality is encapsulated in an inference_session object. It loads the model, sets its input, and iterates over the topologically sorted computational graph. Nodes of the graph are executed via plugins called execution providers.
Execution providers implement the mathematical operations such as matmul or ReLU needed to execute each node. This way each operation’s implementation can be optimized for the hardware the provider targets.

All operations are then implemented in each provider.

Configuration is done via a yaml config file, inspired by Nvidia’s Triton Inference Server.
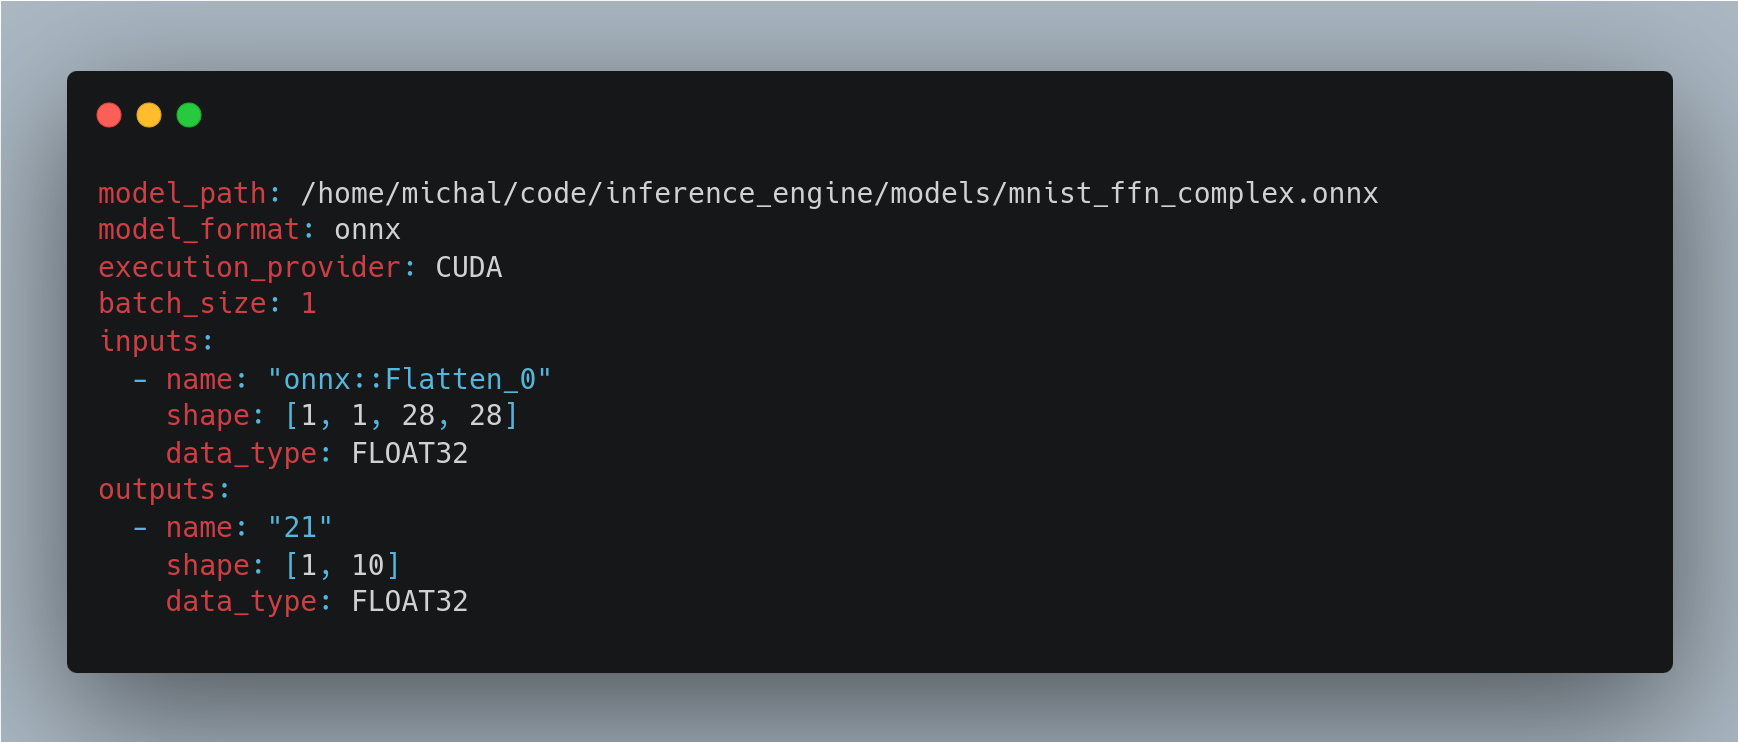
To see the full implementation, feel free to check out the GitHub repository.
Gotta go slow to go fast
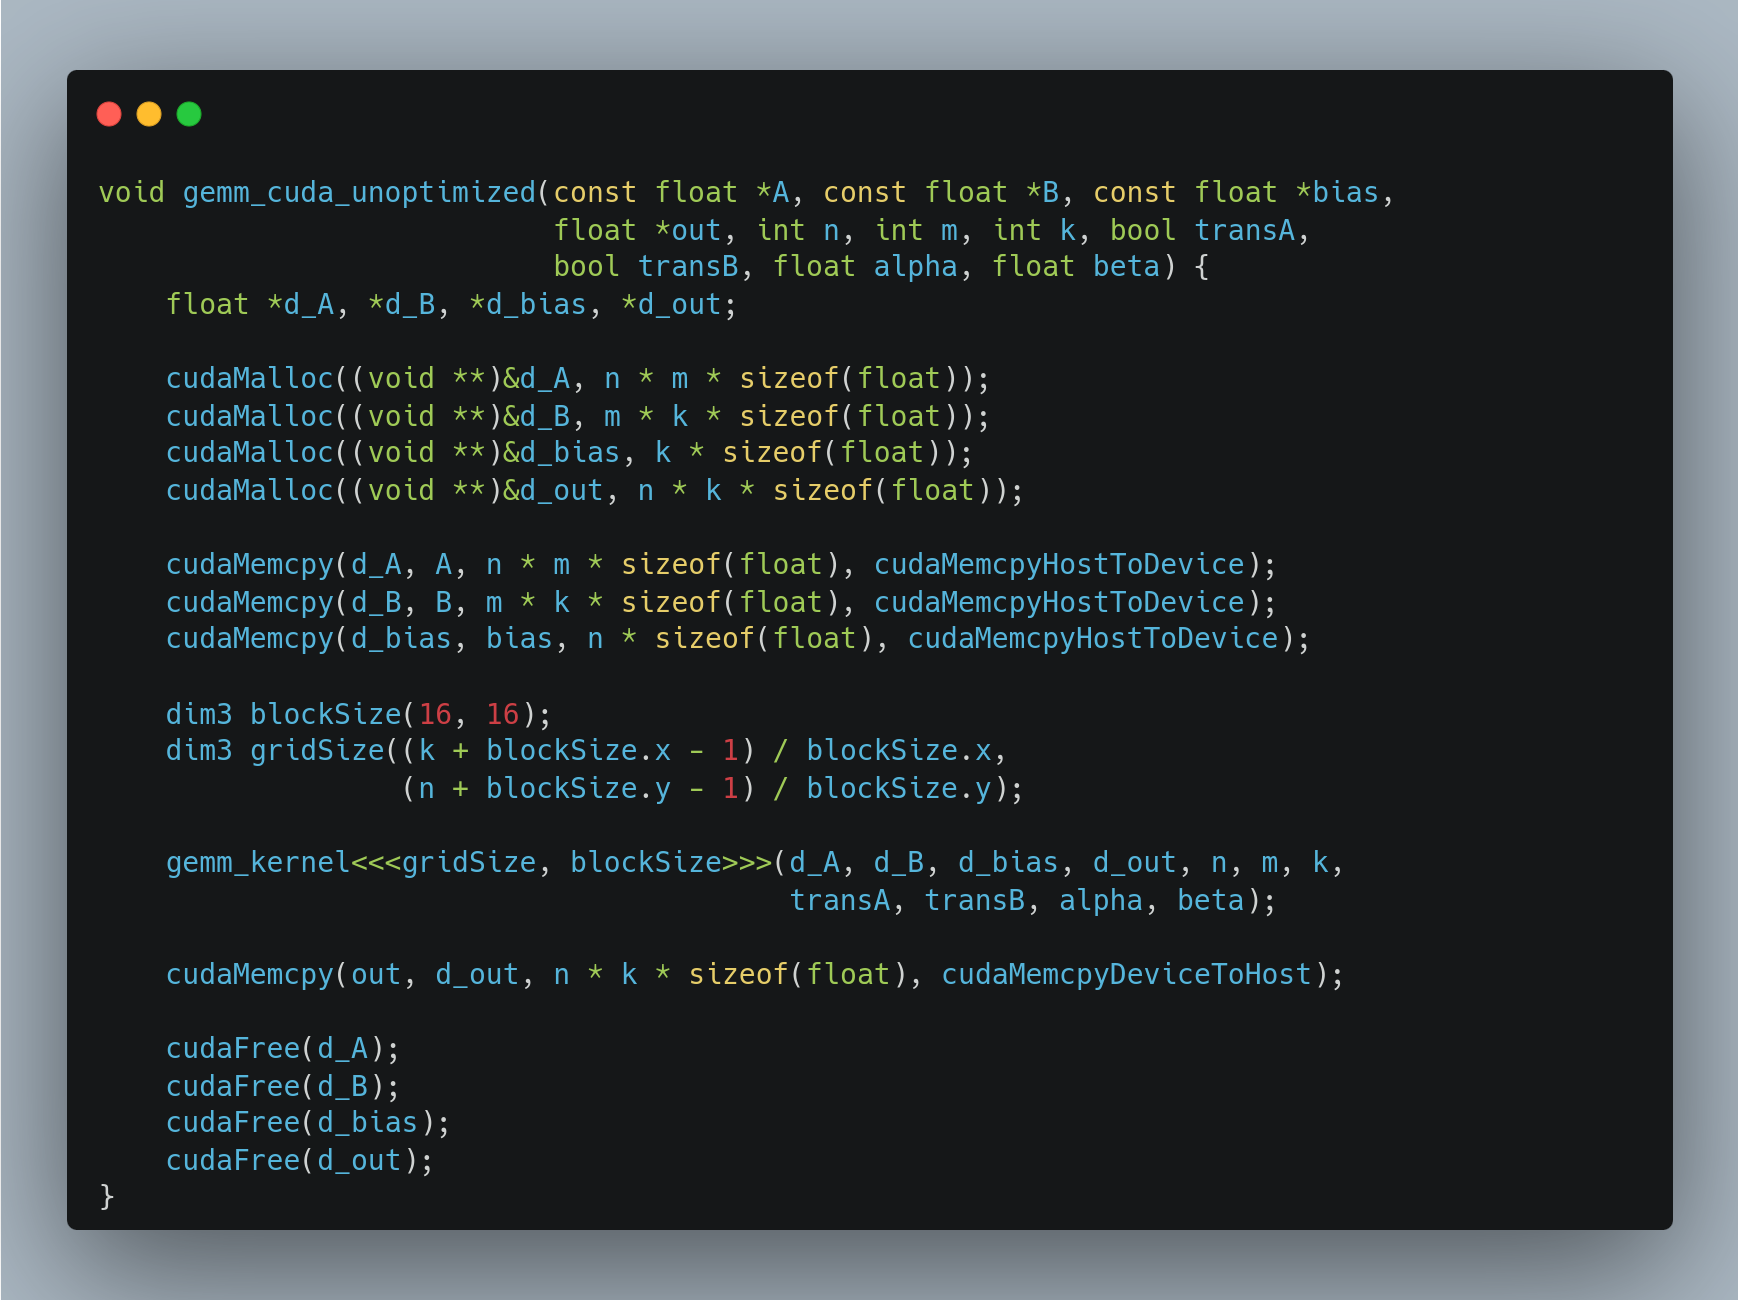
My first attempt at adding CUDA-based matrix multiplication looked something like this. This is pretty common in CUDA samples seen online but has a huge issue!
So, how fast is this? Before we had a throughput of 2300 inferences per second on CPU. *Drum roll* 470 inferences per second: ~4 times slower.
What went wrong?
For every call, this needs to allocate memory on the GPU, transfer data from CPU to GPU, run the kernel, transfer data back to CPU, and finally free GPU memory. Those calls have significant overheads, especially for cheaper operations like ReLU and add.
Until now, I was using a batch size of 1 for inference. We can amortize some of the mentioned overheads by using larger batch sizes. The chart below shows how the throughput changes as we increase the batch size from 1 to 128 for the CPU and the naive CUDA provider.

The CPU provider experiences no scaling with increased batch sizes. The CUDA provider’s throughput is 4x slower for a batch size of 1 and grows to 11x bigger at a batch size of 128.
This is encouraging! Let’s revisit the problem with data transfer overhead and see if we can do anything about performance at smaller batch sizes.
Optimizing memory transfers
We know that all model’s weights are fixed. Once loaded from the disk, we can move them to GPU and keep them there. For inputs and outputs, we need to tolerate some memory transfers at the start and end of each inference call.
What we cannot optimize right now is the creation of intermediate tensors during the inference loop. Those are used to store outputs when we cannot reuse one of the input tensors as the output directly. Allocating new tensors on the GPU involves a call to cudaMalloc and cudaFree for each allocation and destruction respectively and those are relatively expensive as we’ve seen. We’ll see what we can do about this in the next section!
After a few changes to my tensor class and rewriting my CUDA operations to assume data is already on the GPU, here’s our new implementation benchmarked against the previous versions.

We got between 12x to 4x throughput increase by keeping tensors on the GPU as much as possible. The benefits are more pronounced at smaller batch sizes where the overhead from CUDA calls is larger. Nice!
Optimizing intermediate tensor allocations
I noticed intermediate tensor creation and destruction was an issue by profiling the engine with perf and seeing that a lot of the execution time is spent in cudaMalloc and cudaFree calls.
If making multiple cudaMalloc and cudaFree calls is expensive, what if we pre-allocate a large chunk of GPU memory and reuse it? Newly created tensors can get a slice of memory from this memory pool and release it back to the pool when they are destroyed. This way we can completely avoid expensive cudaMalloc and cudaFree calls in the inference loop.
To make this work, tensors accept an optional allocator argument in their constructor. The allocator can internally use a memory pool without the tensor needing to know about this. Each execution provider can implement its allocator or use the default CPU allocator - a thin wrapper around malloc and free.
This allows us to avoid all calls to cudaMalloc and cudaFree during inference as long as we pre-allocate enough memory. Let’s see how it affects performance.

Another 2x to 1.2x increase in throughput! The optimization again has more impact on runs with smaller batch sizes.
Results
This was the last optimization I’ve written, so let’s see what the overall improvement is.
+------------+------------------+----------+
|            |     Throughput   |          |
+------------+------+-----------+ Increase |
| batch size | CPU  | CUDA_pool |          |
+============+======+===========+==========+
|          1 | 2315 |     12048 |        5 |
+------------+------+-----------+----------+
|          2 | 2345 |     23529 |       10 |
+------------+------+-----------+----------+
|          4 | 2306 |     36900 |       16 |
+------------+------+-----------+----------+
|          8 | 2360 |     45454 |       19 |
+------------+------+-----------+----------+
|         16 | 2309 |     60975 |       26 |
+------------+------+-----------+----------+
|         32 | 2328 |     90909 |       39 |
+------------+------+-----------+----------+
|         64 | 2338 |    120481 |       52 |
+------------+------+-----------+----------+
|        128 | 2329 |    144927 |       62 |
+------------+------+-----------+----------+
Pretty nice! Even at a batch size of 1, we are at 5x the CPU performance. Larger batch sizes yield higher throughput up to 60x!
Using batch sizes beyond 128 doesn’t seem to provide much benefit.
If you are curious, the current main bottleneck is the moving of results back to the CPU memory. In a future post, I’d like to explore the impact of pageable and pinned memory on this, possibly using async cuda operations where viable, and maybe adding graph optimizations to fuse kernels such as matmul followed by ReLU.
Stay tuned!
Thanks for reading! Researching and writing these articles takes a lot of time and effort. To ensure you don’t miss the next one, consider subscribing or following me on LinkedIn.
If you enjoyed this article, you might enjoy some of my other work:


Neat! I haven't done modern GPU programming, but I wonder if you can do some analog to double-buffering, which is a standard technique for display, especially when I/O plays a role.
The basic idea is to do the calculations on one set of the data, while doing I/O (or display) on the previous iteration. You then swap where you're doing things (once you're done with I/O, or ready to display the new frame).
In this case, you'd be, e.g. using some of the half of the GPU units to be calculating, and the other half (which had older, finished calculations) would be dumping their results back to the CPU. The trick is getting the two phases roughly similar in terms of time, otherwise it's not a big benefit.
I guess it's really just another view on pipelinining.
Anyway, thank you for an interesting and well-written article!